
Most close-acceleration projects target the wrong week. The time is lost before the accounting begins.
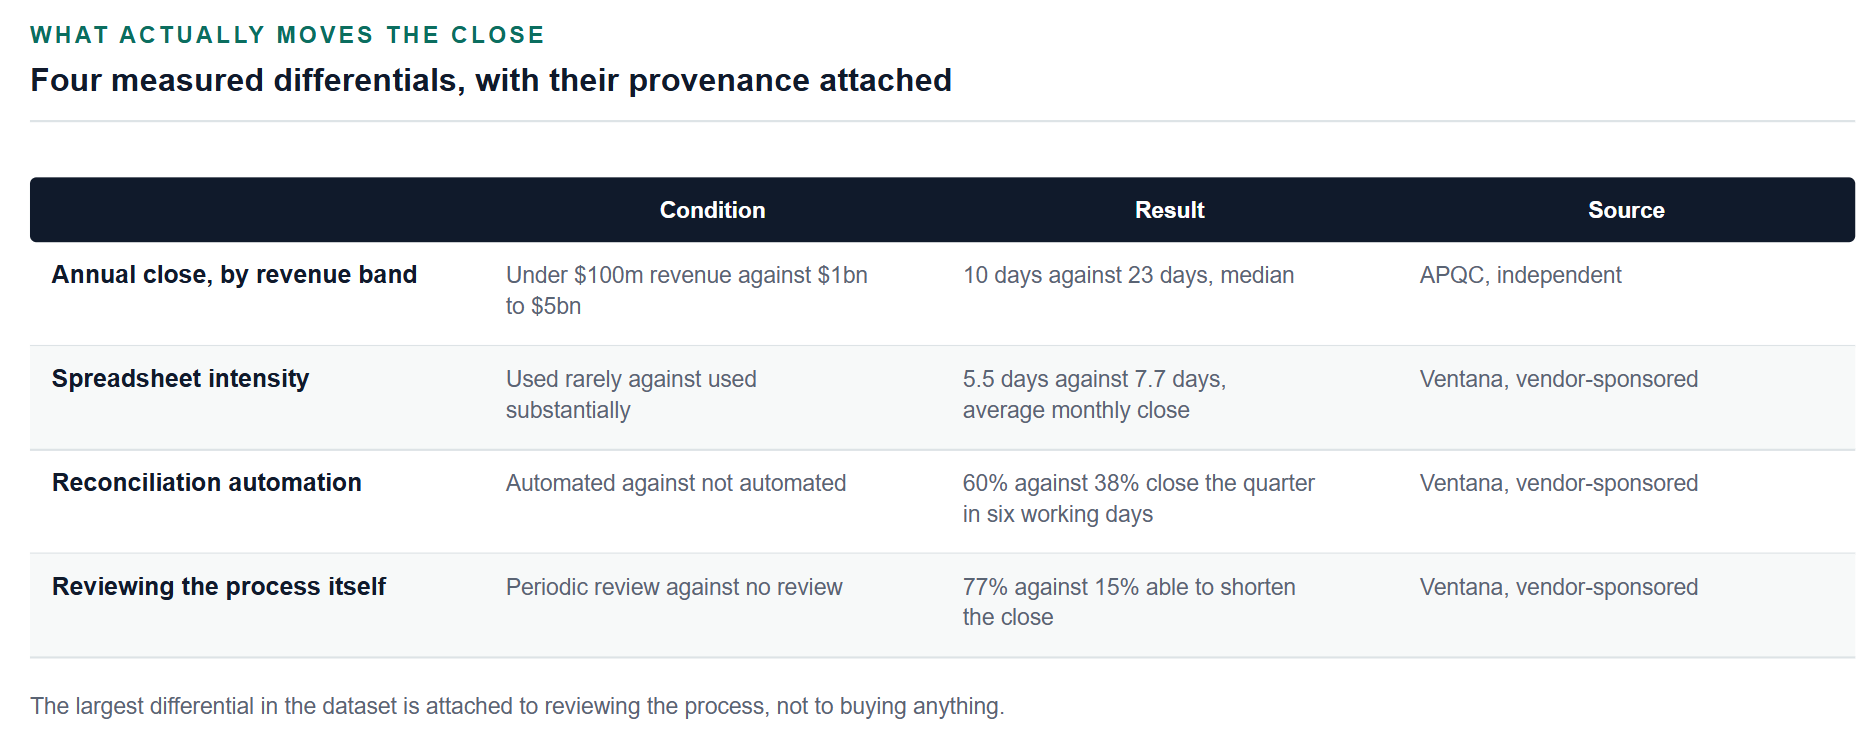
Each row states what was measured and who published it. Only the APQC rows are independent benchmark data; the others come from research sponsored by close-automation vendors, which is stated in the source column.
Ask a finance team why the close takes as long as it does and the answers usually describe accounting work: reconciliations, journals, intercompany, review. Ask them to map where the days actually go and a different picture tends to emerge. A significant share of elapsed time is spent waiting for, chasing and correcting data that originated outside finance.
It is worth being precise about the baseline, because the published figures are routinely mixed up. APQC, which is one of the few independent benchmarking bodies in this area, measures the close in calendar days from running the trial balance to completing the consolidated financial statements. On that definition, top performers complete the annual close in 10 days or less, the median is 18 days and slower performers take 35. Most vendor commentary, by contrast, speaks in business days. A six-day figure from one source and a six-day figure from another are frequently not the same quantity.
The size effect is real, and larger than most teams assume
APQC's revenue segmentation is the most useful independent cut available. Organisations with less than $100 million in annual revenue report a median annual close of 10 days. Organisations between $1 billion and $5 billion report a median of 23 days. That is more than double, and it is not explained by accounting skill. It is explained by the number of entities, systems, currencies and upstream owners that have to be assembled before the accounting can start.
The practical implication is that a target imported from a peer of a different size is not a target, it is a source of frustration. Benchmarks in this area are only useful within a peer group.
Where the days go
Three patterns recur. The first is late inputs: accruals that depend on operational data owned by other functions, arriving on their schedule rather than finance's. The second is correction, where data arrives on time but wrong, consuming the first days of the close in investigation. The third is dependency chains, where one late input blocks a sequence of downstream steps and the delay compounds.
None of those are accounting problems. They are data supply problems that present as accounting delays, which is why close-acceleration projects aimed at the accounting steps frequently produce disappointing results. The team gets faster at the part that was not the bottleneck.
The vendor survey data, for all its limitations, points the same way. In one 2025 survey of 100 finance professionals, the most commonly cited blocker was dependency on other departments and regions, named by 56 per cent, ahead of managing everything in Excel at 50 per cent and legacy systems that do not integrate at 40 per cent. The top blocker is a relationship, not a system.
The measurement most teams do not have
A close timeline typically records when each task was completed. Far fewer record when each task could have started, which is the number that identifies waiting. The gap between those two points, aggregated across a close, is usually the largest single addressable block of time.
Recording it for two cycles is unglamorous and it is the highest-value diagnostic available. It converts a general sense that the close is slow into a specific list of inputs that arrive late, with owners attached.
A close timeline that records completion but not availability can tell you the close was slow. It cannot tell you where the waiting was, which is the only finding that leads anywhere.
Why automation applied first often disappoints
Automation applied to a process with unreliable inputs produces faster processing of unreliable inputs, plus a new class of exceptions when the automation meets data it was not designed for. Matching engines and close-management platforms deliver real value, but they deliver it on top of dependable data supply, not instead of it.
The measured effects support the sequencing rather than the shortcut. Organisations that had automated reconciliations were reported to close the quarter within six working days at 60 per cent, against 38 per cent of those that had not, and companies that periodically review close performance were far more likely to shorten it than those that do not. The differentiator in both cases is a deliberate practice, not the presence of a tool.
The sequence that works is usually the reverse of the one that gets funded: fix the inputs, then automate the handling, then compress the review.
The organisational part
Improving input reliability requires agreements with functions that do not report to finance and do not experience the consequences of being late. That makes it a relationship problem as much as a process one. The approaches that work tend to be specific rather than exhortative: a named owner for each input, an agreed cut-off, and visible reporting of which inputs met it. Making lateness visible, without blame, changes behaviour more reliably than a request for cooperation.
A reasonable first step
For the next two closes, record for each material input when it was needed, when it arrived and whether it required correction. Rank by delay. The top five items on that list are the close-acceleration project, and they are usually cheaper to fix than any software on the shortlist.
A note on the numbers in this piece. APQC's annual close figures are independent benchmark data. The spreadsheet and reconciliation figures come from research sponsored by a close-automation vendor, and the 100-respondent blocker survey was published by a reconciliation-automation vendor. We have used them because they are the only quantified figures available on those questions and because they point the same way as the independent data, but a reader should weigh them accordingly. APQC's monthly-close quartiles sit behind a paywall and the two secondary citations of them in circulation disagree with each other, so we have not printed a monthly figure.
This is reporting on finance operations and technology. It is not accounting, legal or investment advice.
References
Every figure and legal citation in this article is drawn from the sources below. Where an instrument is proposed rather than in force we say so in the text.
APQC, How to streamline the annual closing process and speed year-end close, 8 April 2026. https://www.apqc.org/resources/blog/how-streamline-annual-closing-process-and-speed-year-end-close
APQC, Cycle time in days to perform annual close, measure definition and sample. https://www.apqc.org/what-we-do/benchmarking/open-standards-benchmarking/measures/cycle-time-days-perform-annual-close
Ventana Research, Best Practices for a More Effective Close, sponsored research, 2021. https://www.ventanaresearch.com/hubfs/Research/White_Papers_Research_Perspectives_etc/Finance/Ventana_Research_Perspective_BlackLine_Best_Practices_for_a_More_Effective_Close.pdf
US Securities and Exchange Commission, Form 10-K, General Instruction A(2), filing deadlines. https://www.sec.gov/files/form10-k.pdf
How we work. This article was researched and written by the Financy editorial team. We do not republish press releases. Every number and legal citation is checked against a primary source, which is named and linked above. Where an instrument is proposed rather than in force, we say so. Corrections are made openly on the article itself, never by silent edit. If you believe something here is wrong, write to info@financyhub.com and tell us what and why.
Filed under CFO Tech & FinanceOps · Get The Weekly Brief